The Pacific El Niño satellite maps 2026 released by NASA are giving scientists three different ways to investigate one of the world’s most influential climate patterns. By comparing ocean temperatures, sea-surface heights and subtle changes in ocean colour, researchers can see how the tropical Pacific is changing as El Niño strengthens.
The visualizations compare conditions during 2026 with those recorded during 2025, when a weak La Niña influenced the Pacific. The differences reveal a broad band of unusually warm water, higher-than-normal sea levels across parts of the central and eastern Pacific, and signs of declining phytoplankton in some equatorial waters.
Each map tells a different part of the story. Temperature measurements reveal where the ocean is warming, sea-level measurements help scientists track the movement of warm water, and ocean-colour observations offer clues about changes in marine ecosystems.
Together, these satellite observations help explain why El Niño matters far beyond the Pacific Ocean.
What Do NASA’s Three Pacific Satellite Maps Show?
NASA’s October 15, 2026, visualization combines three ocean data products to compare conditions during the same months in 2025 and 2026.
The maps examine:
- Sea-surface temperature anomalies: Where ocean temperatures are warmer or cooler than normal.
- Ocean colour: Changes that can indicate shifts in phytoplankton abundance.
- Sea-surface height anomalies: Where the ocean surface sits above or below its usual level.
The three datasets come from different satellite instruments and measure different physical properties. Scientists interpret them together because no single observation can explain every stage of El Niño’s development.
The temperature maps show warming across the central and eastern tropical Pacific. The sea-level maps reveal elevated water extending eastward, while the ocean-colour maps indicate changes in the microscopic organisms that depend on nutrients brought to the surface.
These observations are particularly valuable because El Niño involves interactions between the ocean and atmosphere. Changes in winds influence ocean currents and temperatures, while the resulting heat patterns affect atmospheric circulation and rainfall.
1. Ocean Temperature Maps Reveal a Wide Band of Warm Water
The first set of Pacific El Niño satellite maps 2026 focuses on sea-surface temperature anomalies. An anomaly is the difference between a measured temperature and the expected average for a particular location and period.
In the NASA visualization, red and orange areas indicate warmer-than-usual water, while blue areas indicate cooler-than-usual conditions.
The 2026 maps show a prominent band of warm water spreading across the central and eastern tropical Pacific. This pattern contrasts with the cooler conditions visible in the corresponding 2025 maps.
According to NASA’s October 15 report, sea-surface temperatures in the eastern Pacific were approximately 1.7°C (3°F) above the long-term average at the time. NOAA’s October 8 outlook also reported that temperature anomalies exceeded 4°C in parts of the eastern equatorial Pacific, although that figure refers to particular areas rather than the entire region.
These unusually warm waters are a major indicator of El Niño.
Under normal conditions, trade winds generally push warm surface water westward toward Indonesia and Australia. During El Niño, those winds weaken or change, allowing warm water to spread farther east and reducing the normal supply of colder water rising from deeper ocean layers.
Satellites equipped with microwave and infrared instruments help scientists monitor these temperature changes across enormous areas of ocean.
The resulting maps allow researchers to track the location and expansion of warm water, information that is difficult to obtain from ships and buoys alone.
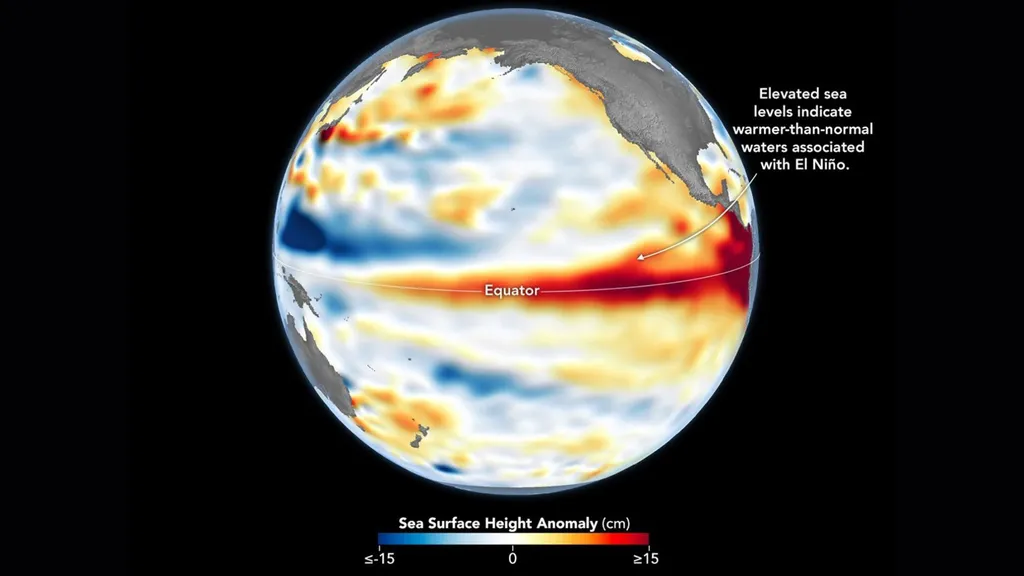
2. Sea-Level Maps Reveal the Movement of Warm Water
The second view uses ocean temperature and sea level data to show how the Pacific’s surface height changes during El Niño.
At first, higher sea levels might seem unrelated to warming. However, warmer seawater expands, increasing its volume. The movement of warm water across the ocean can therefore produce measurable changes in sea-surface height.
NASA’s Sentinel-6 satellites use radar altimeters to measure the height of the ocean surface. These measurements help scientists detect large-scale changes that would otherwise be difficult to observe directly.
In the 2026 maps, red and orange areas indicate higher-than-normal sea levels, while blue areas represent lower-than-normal levels.
NASA reported that a warm-water pulse known as a Kelvin wave was detected moving eastward across the Pacific earlier in the year. By spring, the warm water had reached the eastern Pacific, where higher sea-surface temperatures and elevated sea levels became visible.
In some areas, sea levels rose by approximately 30 to 40 centimetres (about 1 to 1.3 feet) above normal. Meanwhile, sea levels around Indonesia and northern Australia were approximately 15 to 20 centimetres (6 to 8 inches) below normal.
These figures describe regional departures from average conditions, not a uniform rise across the entire Pacific.
The sea-level maps also offer an important historical comparison. In an October 23, 2026, NASA Earth Observatory report, researchers compared the Pacific’s sea-surface height pattern with October 1997, during one of the strongest El Niño events in the satellite record.
The two patterns showed notable similarities, although scientists cautioned that similar ocean conditions do not guarantee identical weather impacts.
3. Ocean Colour Reveals Changes in Tiny Marine Organisms
The third map examines something that is less obvious than temperature or sea level: the colour of the ocean.
NASA’s PACE satellite carries the Ocean Color Instrument, which measures reflected light across hundreds of wavelengths. Researchers use these observations to study phytoplankton, microscopic organisms that form the foundation of many marine food webs.
Phytoplankton contain pigments that influence how ocean water reflects light. Their abundance and composition can therefore affect the colours detected by satellites.
In NASA’s 2026 comparison, parts of the equatorial Pacific appear bluer than they did in 2025. This change is consistent with reduced phytoplankton abundance in some areas.
Why would El Niño affect these organisms?
Normally, winds help drive the upwelling of colder, nutrient-rich water from below the surface. Those nutrients support phytoplankton growth. When El Niño weakens the usual wind-driven circulation and reduces upwelling, fewer nutrients may reach sunlit surface waters.
Phytoplankton populations can then decline, affecting organisms that depend on them for food.
However, ocean colour is not a direct count of phytoplankton. Other factors can influence the light reflected by seawater, so scientists interpret these measurements alongside other observations.
The PACE mission offers a valuable new perspective because it began operating in 2024, allowing scientists to study the 2026 event with advanced hyperspectral ocean-colour measurements.
Why Is El Niño Important for Weather Around the World?
El Niño is part of the El Niño–Southern Oscillation, a natural climate pattern involving changes in tropical Pacific ocean temperatures, atmospheric pressure and winds.
When the pattern strengthens, it can alter the distribution of heat and moisture in the atmosphere. Those changes influence the likelihood of particular rainfall and temperature patterns in different regions.
Some places may face increased flood risk, while others may experience drought. The effects can also influence agricultural production, wildfire conditions, fisheries and water supplies.
The World Meteorological Organization reported in October 2026 that the event was strengthening and could contribute to unusually high global temperatures and substantial shifts in rainfall patterns during the final months of the year.
For farmers, water managers and emergency planners, understanding these changes early can help improve preparation. However, El Niño does not determine the weather at every location, and regional impacts depend on other climate influences as well.
Scientists must combine satellite measurements with atmospheric observations, ocean buoys and climate models to develop more useful seasonal outlooks.
Could the 2026 El Niño Rival the Historic Event of 1997 – 98?
The similarities between the 2026 and 1997 sea-level maps have attracted particular attention.
NASA’s October 23 comparison showed higher-than-normal sea levels stretching across the central and eastern equatorial Pacific in both periods. This pattern is associated with the buildup of warm water during El Niño.
NOAA’s October 8 outlook gave an 83% probability of a strong-to-very-strong El Niño continuing through January–March 2027. The agency also assessed the possibility of a historic event, using its own criteria for unusually strong conditions.
Nevertheless, scientists cannot determine the full strength and consequences of the event from one map alone.
The 1997–98 El Niño contributed to major weather disruptions, but every event develops differently. The location of the warmest water, the response of atmospheric circulation and other climate patterns all influence the eventual outcome.
Satellite records are especially useful because they allow scientists to compare today’s ocean with previous events using consistent types of measurements.
The comparison helps researchers identify similarities without assuming that history will repeat itself exactly.
What Happens Next?
NASA will continue monitoring the Pacific with satellites that measure temperature-related signals, sea-surface height and ocean colour. Researchers will combine those observations with measurements from buoys, ships and other instruments.
As new data arrive, scientists can track whether warm water continues spreading eastward, whether sea-level patterns strengthen and how ocean ecosystems respond.
The most important next step is to connect these ocean changes with atmospheric observations. That combination will help researchers improve forecasts and better estimate the likelihood of regional droughts, heavy rainfall and extreme heat.
The Pacific El Niño satellite maps 2026 demonstrate why observing several aspects of the same ocean system is so useful. Temperature, sea level and ocean colour provide different clues, but together they offer a more complete picture of a changing Pacific.
Conclusion: Three Views, One Changing Ocean
NASA’s three satellite views reveal that El Niño is more than a patch of warm water. It is a connected ocean-atmosphere process that changes temperatures, redistributes heat, alters sea levels and affects marine ecosystems.
The temperature maps identify unusual warming. The sea-level maps show how warm water moves and accumulates, while ocean-colour observations reveal potential changes in the microscopic organisms that support marine food webs.
These observations do not predict every storm or drought, but they help scientists understand the developing climate pattern and assess possible consequences.
As monitoring continues into 2027, satellite measurements will remain an important tool for tracking the event and improving our understanding of the Pacific’s influence on global weather.
Follow TopTenDose for more climate science, satellite discoveries, environmental news and major developments from around the world.